(주)비젼테크
3D(SCANING, MEASURING, MODELING, PRINTING) BEST 3D SCANNER & 3D SOLUTION PARTNER
제품소개
고객지원센터
02)786-4929
BlastMetrix
BlastMetriX3D는 세이프메트릭스와 같이 3차원 이미지를 기반으로
경사단면(bench face)측량과 발파설계를 계획하는데 혁신적인 시스템입니다.
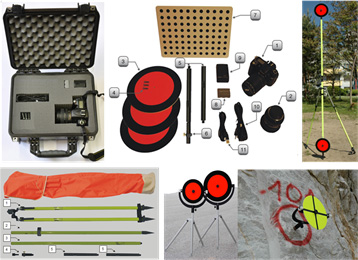
SMX BlastController는 발파전용 사진측량 소프트웨어로써 SMX BlastPlanner와 ShapeMetriX3D 시스템으로 구성되어 있습니다. 기본 구성은 카메라, 신호기(signalling element), Delimiterf로써, Delimiter는 발파부위 Edge 근처에 놓아 주면 됩니다.
이미지 분석 소프트웨어는 사진으로부터 3D이미지를 생성 내는 부분, 3D 측정, 분석 및 평가, 발파 계획(Blast Planning) 두 부분으로 이루어 집니다.
 BMX UAV 제품소개
 특징
특징

BMX Standard 제품소개
특징

Examples
Step 1 3D image generation
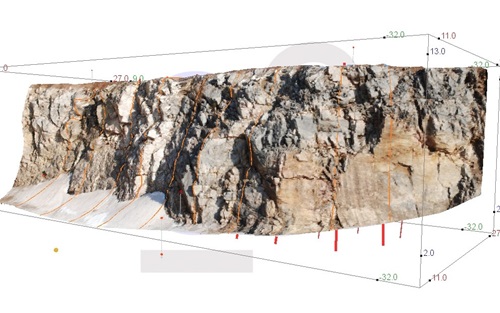
Figure 2: 3D image of a bench face together with planned boreholes and visualised profiles. In addition to the
geometric blast planning, the quality of the rock surface becomes assessable. From the 3D image weak zones or
more fractured zones are rated in a straightforward manner.
Step 2 Planning the blast
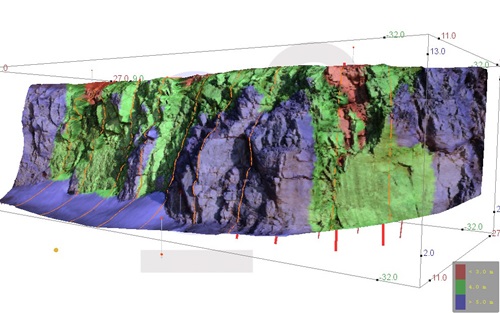
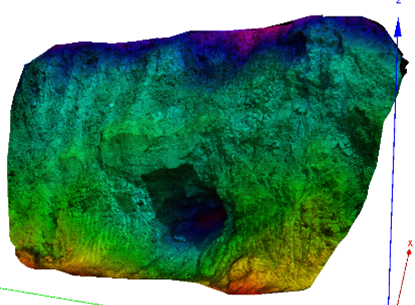
Figure 3: Colour-coded visualisation of burden over the entire bench face (categories configurable) highlights light
burden areas (red zones)
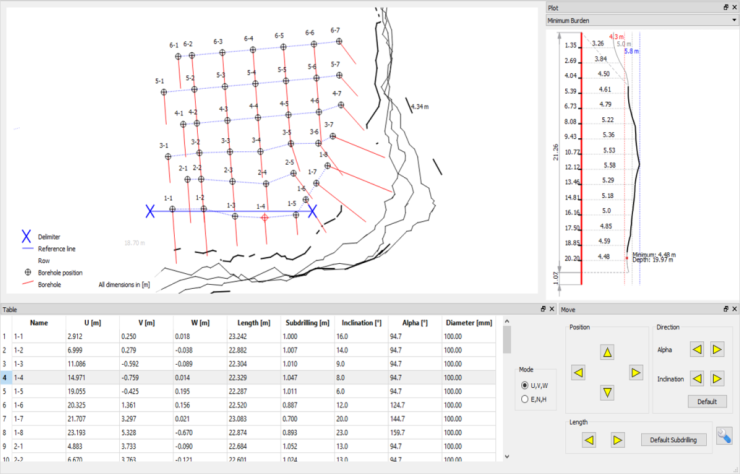
Figure 4: Drill pattern with minimum burden diagram of selected borehole as well as geometric parameters such as
length of borehole, inclination, location of collars etc. Each hole is individually adaptable; profiles, minimum burden
diagrams, and colour-coded burden over the entire area serve as data basis.
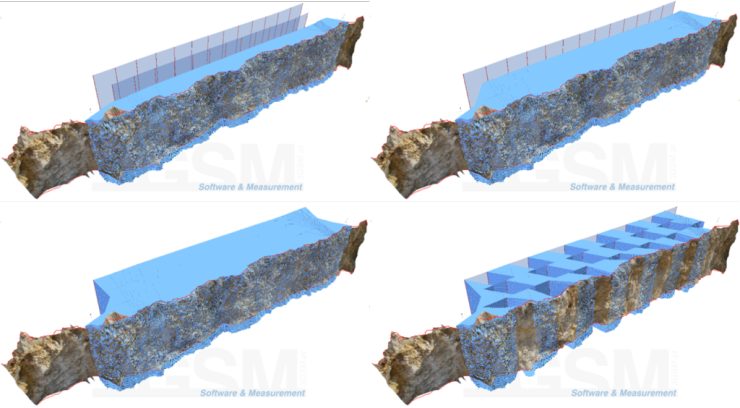
Blast site volume
Calculated volume increment for single borehole lines, the entire blast site and single boreholes.
Complex geometries
Large blast sites (latitude several hundred metres) or corners are acquired by merging several images.
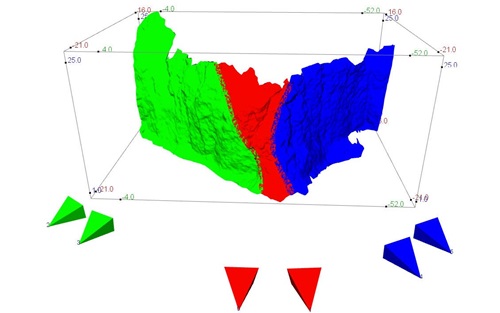
Figure 5: When capturing a corner several imaging locations are required. The software merges them without using
any special markers
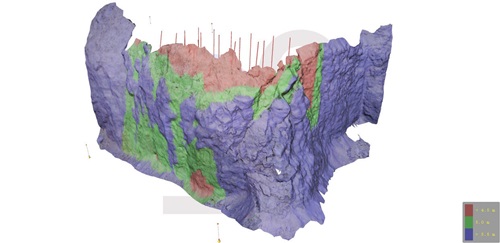
Figure 6: 3D image of corner with colour-coded burden over the entire area. In this case the importance of a true
360°search for the minimum burden becomes particularly evident as otherwise light burden zones around the
corner would be missed.
Step 1 3D image generation
Figure 2: 3D image of a bench face together with planned boreholes and visualised profiles. In addition to the
geometric blast planning, the quality of the rock surface becomes assessable. From the 3D image weak zones or
more fractured zones are rated in a straightforward manner.
Step 2 Planning the blast
Figure 3: Colour-coded visualisation of burden over the entire bench face (categories configurable) highlights light
burden areas (red zones)
Figure 4: Drill pattern with minimum burden diagram of selected borehole as well as geometric parameters such as
length of borehole, inclination, location of collars etc. Each hole is individually adaptable; profiles, minimum burden
diagrams, and colour-coded burden over the entire area serve as data basis.
Blast site volume
Calculated volume increment for single borehole lines, the entire blast site and single boreholes.
Complex geometries
Large blast sites (latitude several hundred metres) or corners are acquired by merging several images.
Figure 5: When capturing a corner several imaging locations are required. The software merges them without using
any special markers
Figure 6: 3D image of corner with colour-coded burden over the entire area. In this case the importance of a true
360°search for the minimum burden becomes particularly evident as otherwise light burden zones around the
corner would be missed.
 제품소개
제품소개
 특징
특징
  |
|
Hardware 구성
|
 |
Software 구성
|
|
 |
|||||
|
|
||||||
|
|
||||||
|
|||||||
사양
| Shapemetrix3D | Blastmetrix3D | |
|---|---|---|
| 특징 및 장점 | 무 타켓/비 접촉으로 실제의 이미지와 함께 수 백만 3D 포인트가 생성된 생성 (레이저 스캐너와 같은 기능) |
ShapeMetrix3D를 바탕으로 BlastPlanner에서 발파계획 수립 |
| 주요용도 |
- 암반, 사면, 침하량, 침하방향, 방위각/수직각 분석 - 길이, 균열 간격, 면적, 체적, 채굴량 계산 - 막장, 불연속면의 방향, 길이, 위치분석 - 암사/토사 면의 안정성 및 이동상황 분석 - Dip&and Dip, Dip Direction, Orientation |
- Drilling plan - Bore Hole - Positioning – 하중방향, 발파량 |
| System 구성 | 1. 이미지 취득 - 일반/상용 카메라(1020만 화소) 2. JMX/SMX Reconstructor software - 이미지를 포함한 수백만 3D 포인트와 3D이미지 생성 3. JMX/Analyst – 3D 측정 및 분석 |
1. 3D 이미지 획득 - ShapeMetrix3D(카메라사진 부분은 ShapeMetix 셀과 ‘셀 병합’ 시킵니다.) 2. Delimeter 3. BlastPlanner 발파계획 수립 |
| 소요 사진 수 | 2장 | |
| 계측 정확도 | - 입력하는 Reference Point의 정확도에 따르며, 일반적으로 1~2mm(50M이하) 2~3cm (100~1000M)임 - 정밀 측정한 Control Point를 사용하면 mm이하 가능 |
|
| 3D 이미지 생성시간 |
3분 이내 | 사진촬영부터 Borehole Plan 까지 1시간 이내 |
| 데이터 포맷 | DXF, VRML, Inventor, XYZ, CSV(MS Excel), TXT | |
ShapeMetrix-UAV | BlastMetrix-UAV | |
|---|---|---|
특징 | 정확한 문서화 | 표면의 윤곽 (적재도표 및 지도) |
ShapeMetrix-TBM | ||
|---|---|---|
주요기능 |
터널면의 3D 획득,암반조건에 대한 영구적인 문서,확장되고 지향된 3D 이미지,지질지도 | |
구성요소 |
자율 TBM 이미징 유닛 원형 3D 이미지의 생성 및 정렬을위한 소프트웨어 3D 이미지 및 기하학적 암석 특성 평가를위한 소프트웨어 JMX Analyst |
|
종류
|
 |
|||
|
 |
|||
|
- SMX BlastController는 발파전용 사진측량 소프트웨어로써 SMX BlastPlanner와 ShapeMetriX3D 시스템으로 구성되어 | ||||
![]() Shapemetrix-UAV
Shapemetrix-UAV
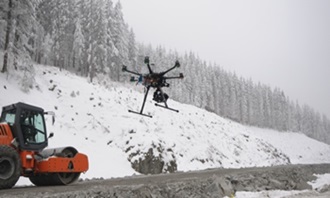
Shapemetrix-UAV는 정확한 3D 이미지가 컴퓨터에서 생성되는 적절한 원격제어 항공기(마이크로-드론)에서
보정된 카메라로 고품질의 사진을 찍습니다. 3GSM은 볼륨측정, 발파 디자인 및 암석 질량 특성화와 같이
one_stop으로 제공합니다.
Blastmetrix-UAV는 표면의 윤곽과 형상, Blast 디자인과 분석을 위하여 무인항공 사진으로 3D 이미지를 생성합니다. 공중 3D 이미지는 특히 벤치 사이트와 폭파 사이트 기하학을 최적의 위치에서 확보 할 수 있습니다. 3D 모델을 사용하면 드릴 패턴이 기하학적 조건 및 지질조건에 따라 조정됩니다. 불량한 블라스팅 결과는 종종 앞줄 구멍 배치의 부정확성과 블래스트패턴 형상의 부정확성으로 인해 발생합니다. 드론의 3D이미지는 대규모 발파현장을 완벽하게 조사할 수 있습니다. |
|
ShapeMetrix TBM은 TBM을 사용한 하드록 터널링 중 디지털 터널면 문서화를 위한 3D 이미징및 분석 시스템입니다. 자율적 이미징 유닛은 유지보수 시프트 중에 검사개소가 설치됩니다. 커터헤드를 돌리면 원형비디오가 캡처되며 고급 소프트웨어 확장 및 측정이 촬영되는 3D이미지를 생성합니다. |
적용분야
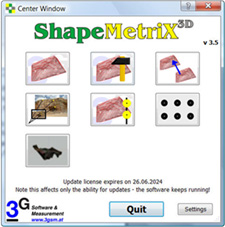
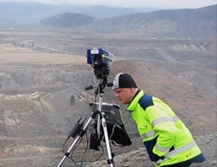
ShapeMetriX3D is an innovative system to acquire surfaces with three-dimensional images.
For data acquisition a standard digital camera is used which is calibrated by software from 3GSM. With it the area of
interest is (freely) captured from two angles.
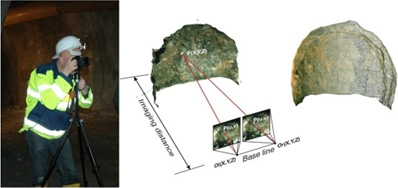
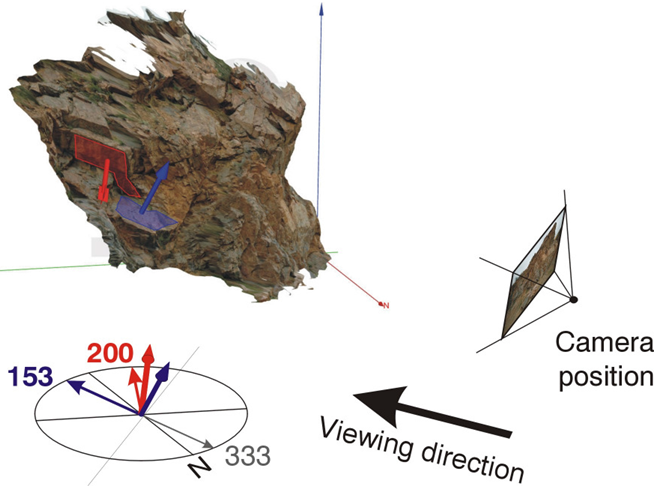
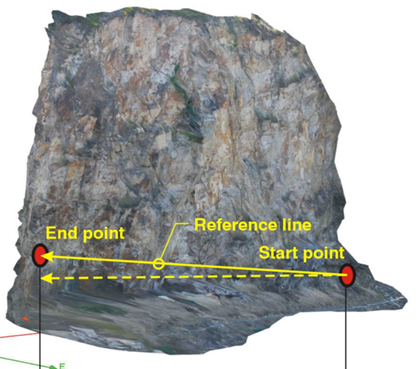
Figure 1: ShapeMetriX3D principle: a 3D image is computed from digital photos; it conserves the visual and
geometric situation.
From the photos a 3D image is computed using award-winning software from which measurements are taken.
Features:
![]() Reproducible acquisition of rock mass conditions
Reproducible acquisition of rock mass conditions
![]() No more access problems and no pressure of time for the assesment
No more access problems and no pressure of time for the assesment
![]() Measurement of position, distances, areas
Measurement of position, distances, areas
![]() Sectional views (cross sections), profiles
Sectional views (cross sections), profiles
![]() Measurement of spatial orientations (dip angle & dip direction)
Measurement of spatial orientations (dip angle & dip direction)
![]() Geological/geotechnical assessments
Geological/geotechnical assessments
![]() Discontinuity spacing
Discontinuity spacing
![]() Hemispherical plots
Hemispherical plots
![]() Discontinuity set clustering
Discontinuity set clustering
![]() Statistics on spatial distribution of orientation measurements.
Statistics on spatial distribution of orientation measurements.
![]() Scanline
Scanline
![]() Discontinuity modelling
Discontinuity modelling
![]() Data export (CSV, DXF, OBJ)
Data export (CSV, DXF, OBJ)
Examples
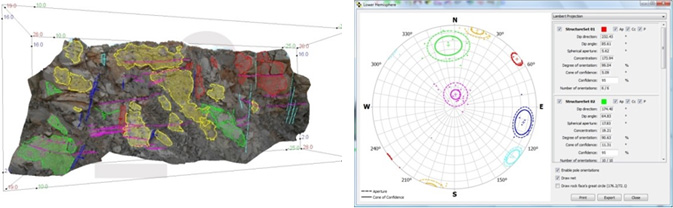
Figure 2: 3D image of 15 m wall taken in an open pit together with measured discontinuity orientations as
well as identified joints sets in a hemispherical plot.
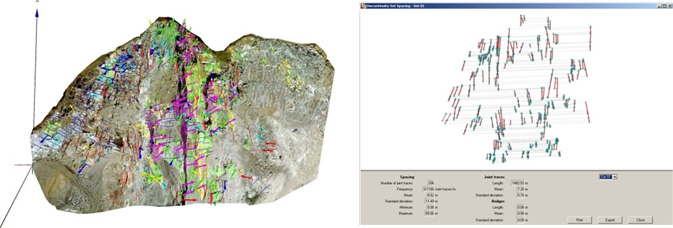
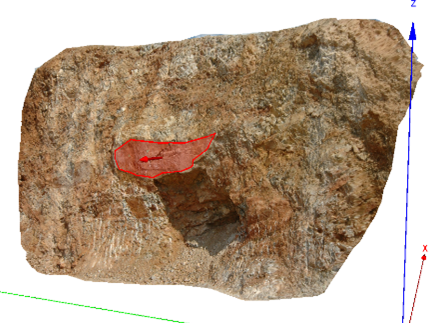
Figure 3: 3D image of 120 m rock wall with extensive interpretation of the inaccessible hazardous area as well as
plot for determining the spacing of one discontinuity set.
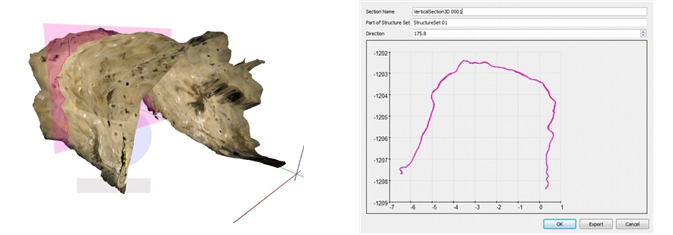
Figure 4: 3D image of a drift tunnel in a deep underground mine together with a sectional view.
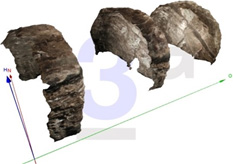
Figure 5: Several tunnel faces in a common representation within the software
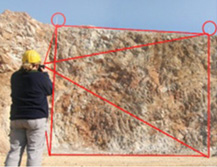
BlastMetriX3D is an innovative system for bench face surveying and planning of blast layouts based on
three-dimensional images. After setting up field markers at least two photos are taken using a pre-calibrated digital
SLR camera. From the photos a three-dimensional image of the bench face is generated by purpose built software.
The result is a metric 3D image representing a dense three-dimensional survey of the rock surface.
Using another software component the geometry of the blast is planned, optimized, and plan views for drilling and
documentation purposes are generated.
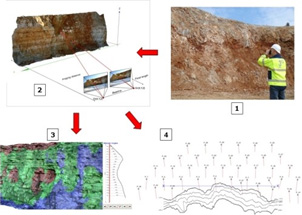
Figure 1 : The BlastMetriX3D principle: from freehand taken pictures (1) a 3D image (2) of the bench face is
computed. The 3D image includes geometry and geology of the bench face and thus allows for an optimal planning
of the blast site by visualising the true burden over the entire area (3), as well as profiles and plan views (4).
Features:
![]() increases working safety (contact-free measurements).
increases working safety (contact-free measurements).
![]() allows for an optimised loading and subsequently for better blasts.
allows for an optimised loading and subsequently for better blasts.
![]() reduces production costs (independent reports exist).
reduces production costs (independent reports exist).
![]() provides reproducible documentation (conservation of evidence) at a degree of quality superior to measurement
provides reproducible documentation (conservation of evidence) at a degree of quality superior to measurement
techniques without imagery.
![]() allows to incorporate geological assessments during blast planning.
allows to incorporate geological assessments during blast planning.
![]() provides essential support in fly-rock prevention and vibration reduction.
provides essential support in fly-rock prevention and vibration reduction.
![]() is efficiently applied on site and quickly learned due to its ease of use.
is efficiently applied on site and quickly learned due to its ease of use.
Examples
Step 1 3D image generation
Figure 2: 3D image of a bench face together with planned boreholes and visualised profiles. In addition to the
geometric blast planning, the quality of the rock surface becomes assessable. From the 3D image weak zones or
more fractured zones are rated in a straightforward manner.
Step 2 Planning the blast
Figure 3: Colour-coded visualisation of burden over the entire bench face (categories configurable) highlights light
burden areas (red zones)
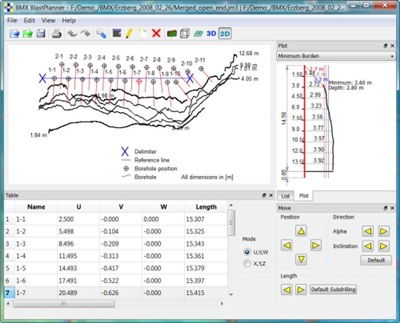
Figure 4: Drill pattern with minimum burden diagram of selected borehole as well as geometric parameters such as
length of borehole, inclination, location of collars etc. Each hole is individually adaptable; profiles, minimum burden
diagrams, and colour-coded burden over the entire area serve as data basis.
Complex geometries
Large blast sites (latitude several hundred metres) or corners are acquired by merging several images.
Figure 5: When capturing a corner several imaging locations are required. The software merges them without using
any special markers
Figure 6: 3D image of corner with colour-coded burden over the entire area. In this case the importance of a true
360°search for the minimum burden becomes particularly evident as otherwise light burden zones around the
corner would be missed.
갤러리
-
지면 3D -
피라미드 구조 창 3D 제… -
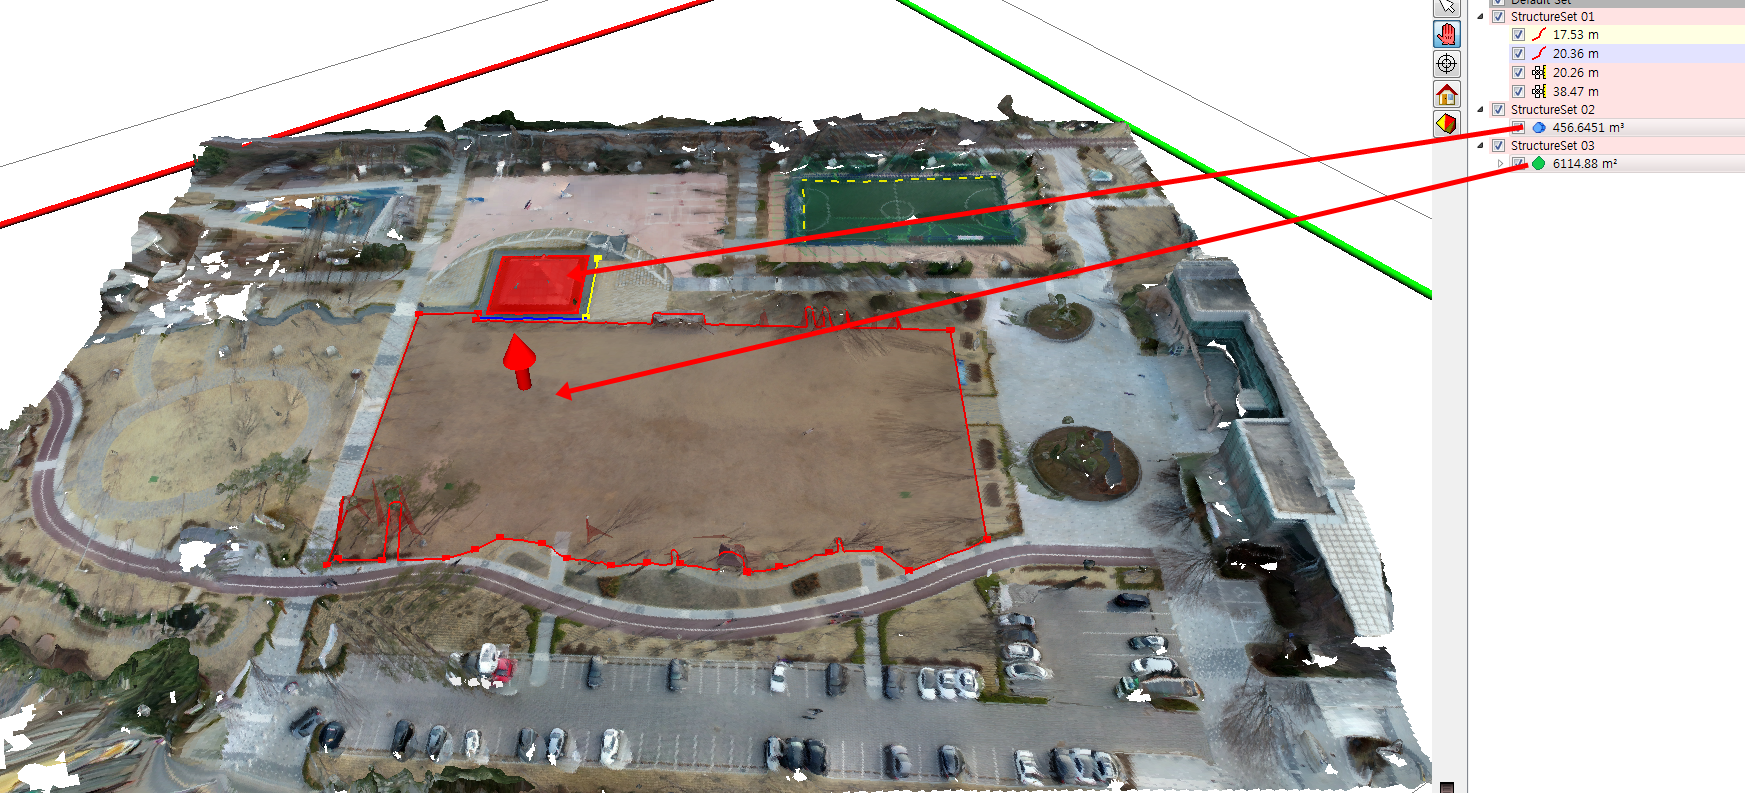
거리,면적,부피 계산 -
SMX SurfaceTrimmer -
SMX Normalizer & Referencer -
SMX ModelMerger -
형상분석 -
표고차에 의한 색상
동영상
-

ShapeMetrix3D -

Blastmetrix 소개 - 절개지 분… -

JointMetrix3D 소개 사면분석/… -

토목공사 대형 3D 스캔데이… -

항공사진 3d데이터 동영상 -

샘플 3d 데이터 동영상